When companies come to ManagerPlus looking for our maintenance management software and expertise, it’s not because they aren’t familiar with preventive maintenance. The vast majority are already performing routine oil changes, replacing HVAC filters, lubricating heavy machinery, performing safety inspections, etc.
In most cases, what they need is for us to assist them in performing these services more efficiently–and we’re extremely effective at helping them accomplish this. So much so, in fact, that they’re often faced with a new dilemma: they now have spare resources and capacity that could be used to perform more advanced forms of preventive maintenance, but they’re not sure if doing so would yield additional benefits.
In other words, we’re able to help them make it so easy to do the preventive maintenance they’ve always been doing, they now have to ask whether they should do more, and whether there is such a thing as too much.
So…is there?
The answer is: it depends, but generally speaking, there’s no such thing as too much preventive maintenance if you’re doing it properly.
According to “Maintenance and Reliability Best Practices” by Ramesh Gulati, companies that run “Best Practice Benchmark” operations schedule between 10-40% of their maintenance work. World class organizations, on the other hand, schedule upwards of 85% of their overall maintenance workload.
The thinking here is that, by proactively scheduling as much of their maintenance work as possible, these companies are able to maximize equipment up-time, utilization rates, and resale value. This makes sense–most authoritative sources suggest that preventive maintenance is that effective that it can be up to 20 times more cost effective than run to failure maintenance.
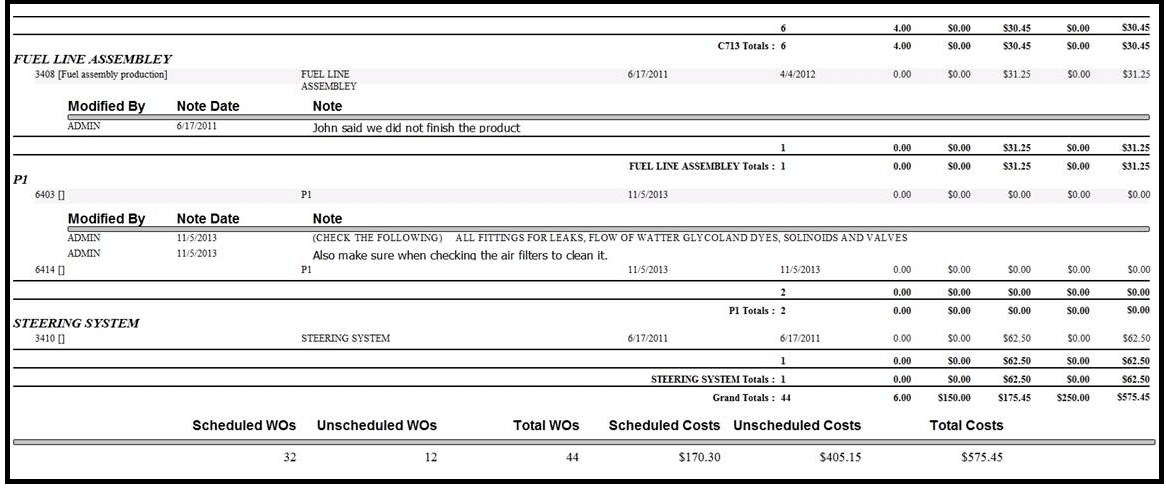
Using preventive maintenance software, it’s easy to determine how much of your work is scheduled versus unscheduled. The quickest way to find this information is to run the “Work Order Summary” report in the Reports Module (in our Enterprise Desktop product). This will show a quick count of the number of work orders associated with scheduled work as well as the number that were associated with unscheduled work. Dividing the number of unscheduled WOs by the total overall (unscheduled plus scheduled) and multiplying the result by 100 will give you the percentage of unscheduled work orders.
In the below example (a partial view of the final page of the Work Order Summary report), we can see the count of Scheduled WOs listed as 32, and the count of Unscheduled WOs listed as 12. If we take the 32 scheduled WOs and divide it by the Total WOs–44 in this case–and then multiply the result by 100, we come up with 72.7%.
Thus, in this example, the company seems to be doing an excellent job of scheduling their work. At 72.7%, they’re close to the world class range of 85% or more. But work order count is just one way to look at this data.
You can get an even more detailed look at the labor and other costs associated with scheduled versus unscheduled work orders by running the “Work Order Count” report for both scheduled and unscheduled work. Select the report, set the same data range, and use the report criteria to show only work orders with a work type of “Preventive” (this type may be named differently for your company), they are doing right preventive maintenance practice This will give you totals for the hours, labor costs, part costs, and other costs, as well as a count of the number of work orders associated with this work type.
Set this report aside for a moment. Go back into the program and run the same report, leaving everything the same except this time filter the results by the work type “Reactive” (Note that this work type may be named something different in your system–some companies call these emergency repairs, or else use multiple work types for unplanned work, in which case all of these statuses will need to be included in the filter settings).
Each report should look something like the below example (the data in the below example is different from the previous example). Now you can compare just the labor and parts costs for unscheduled versus scheduled work to see for yourself which is more expensive–the results may surprise you.
Calculating the scheduled versus unscheduled percentage for labor might show you a totally different picture than if you only base your calculations on the work order count. For instance, 70% of your WOs might be associated with scheduled labor, but when you look at just the labor, maybe only 30% of your work is scheduled. In other words, even though there are more WOs associated with scheduled maintenance, that might not be a totally accurate gauge of the resources that are being devoted to it.
Above all, this information will allow you to watch these numbers over time to see the impact of moving toward more preventive maintenance. Over time, if you can increase the proportion of your work that is scheduled, you should start to see your overall costs fall. WMATA was able to maintain their fleets by preventing initial problems to not grow into critical issues using preventive maintenance, explained here.
It’s important to watch these numbers, as there can be cases when preventive maintenance isn’t being performed efficiently. If services aren’t being tracked consistently, there is risk of duplication and waste, which can cut into your gains.
With an industry-leading maintenance management software like ManagerPlus, it will be much easier to schedule more of your maintenance, and run the reports that will show you the benefits of doing so.
[blog_cta id=’87f123ee-ba69-4976-b1c6-61ef65196f7c’]


