Centralizing and standardizing parts inventory data is a critical first step toward cutting costs and improving allocation. But without data navigation know-how, this information will be of little use. ManagerPlus was designed with this in mind, offering intuitive controls that make analysis of inventory data quick and easy. We’ve put together a brief guide on how to use “List Grouping,” “Group Footers,” and “Print List”–a few of the ways ManagerPlus makes it easy to group and arrange data for quick insight and basic reporting.
Click on any image to enlarge. Note that your data will vary likely vary from the below examples.
Step 1
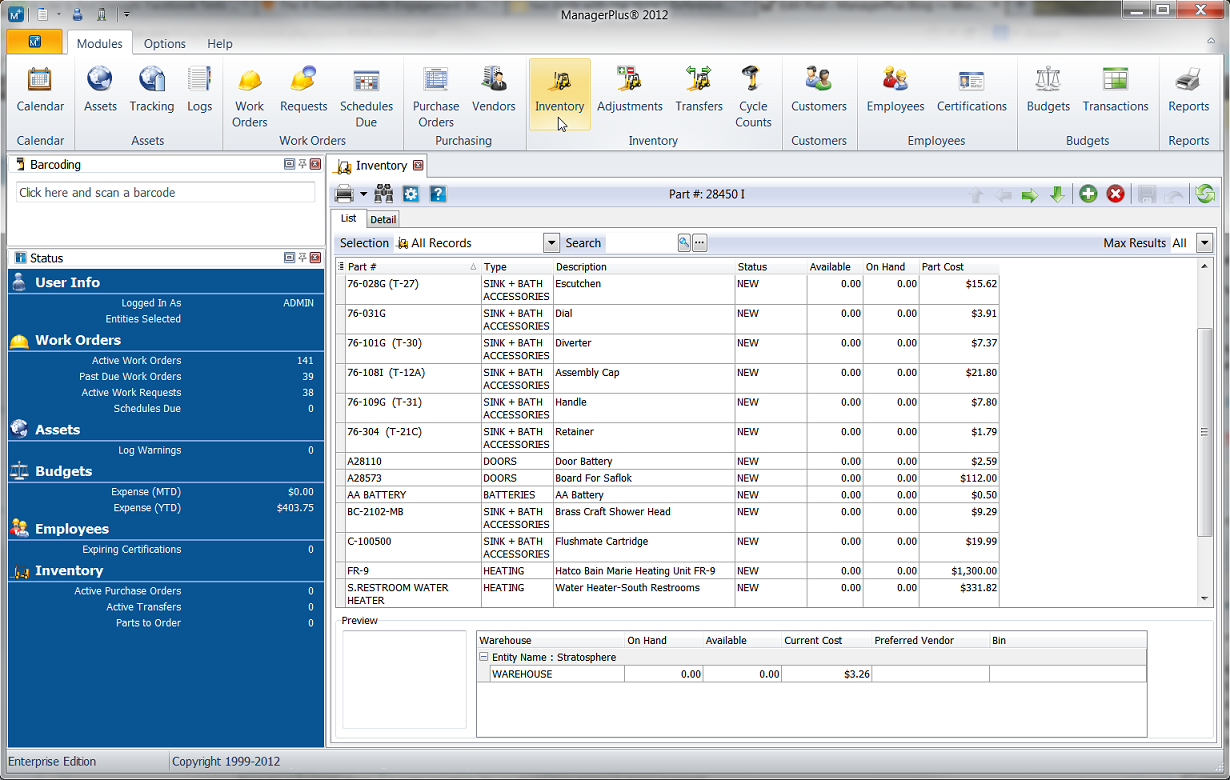
Open ManagerPlus and click on the Inventory module
Step 2
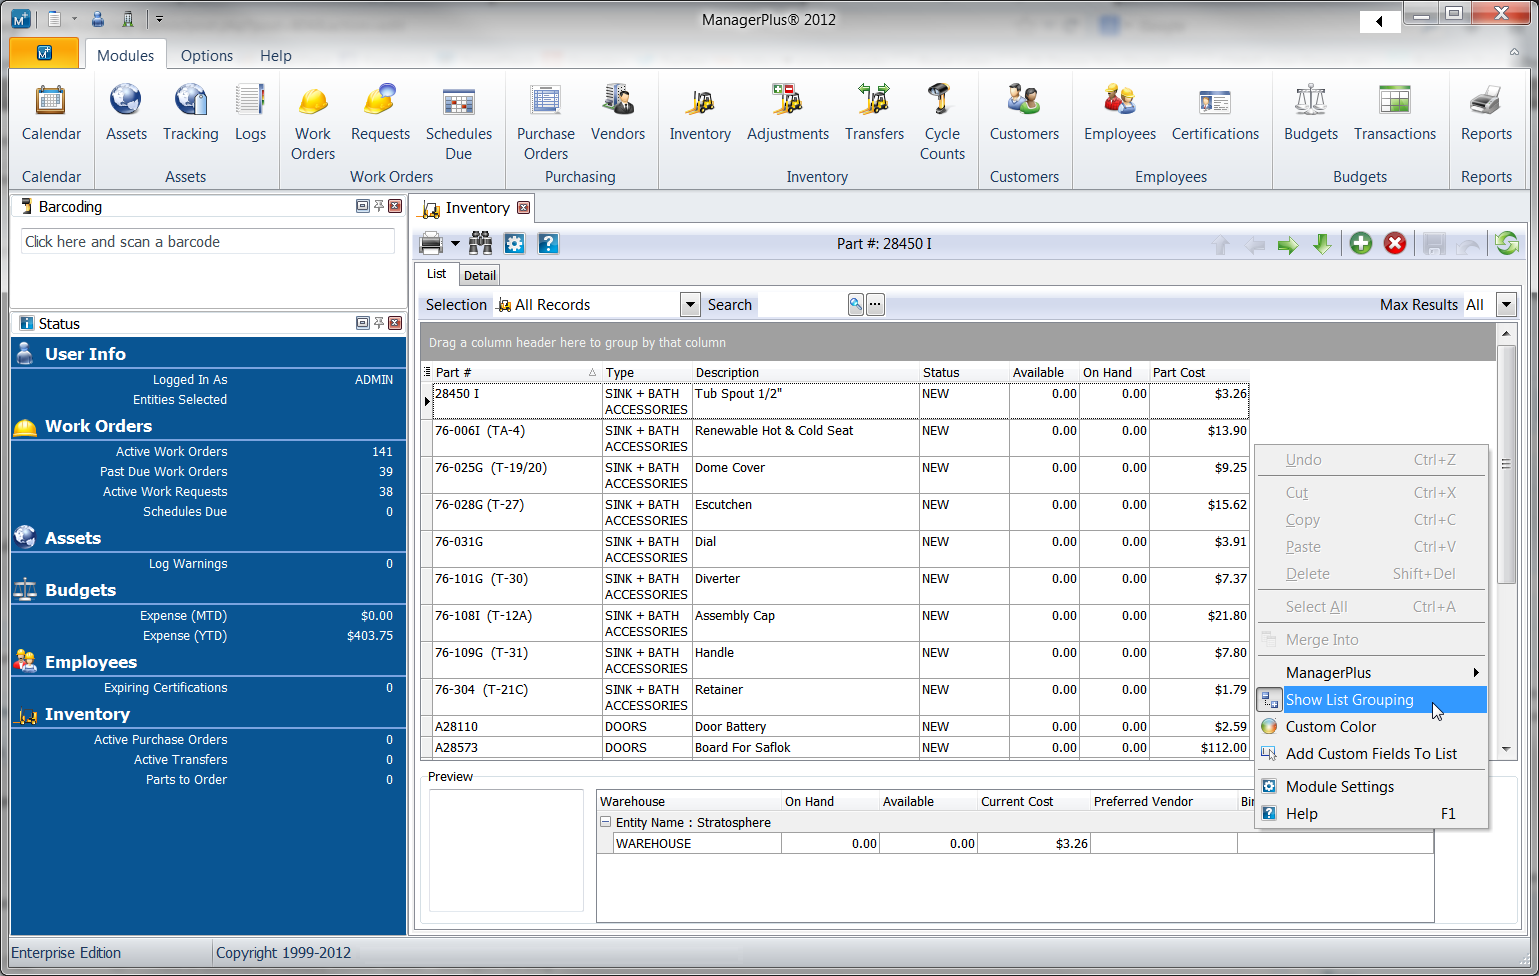
Right click anywhere within the Inventory module and select “Show List Grouping” from the menu that appears. A black bar will appear above the parts list with the prompt, “Drag a column header here to group by that column.”
Step 3
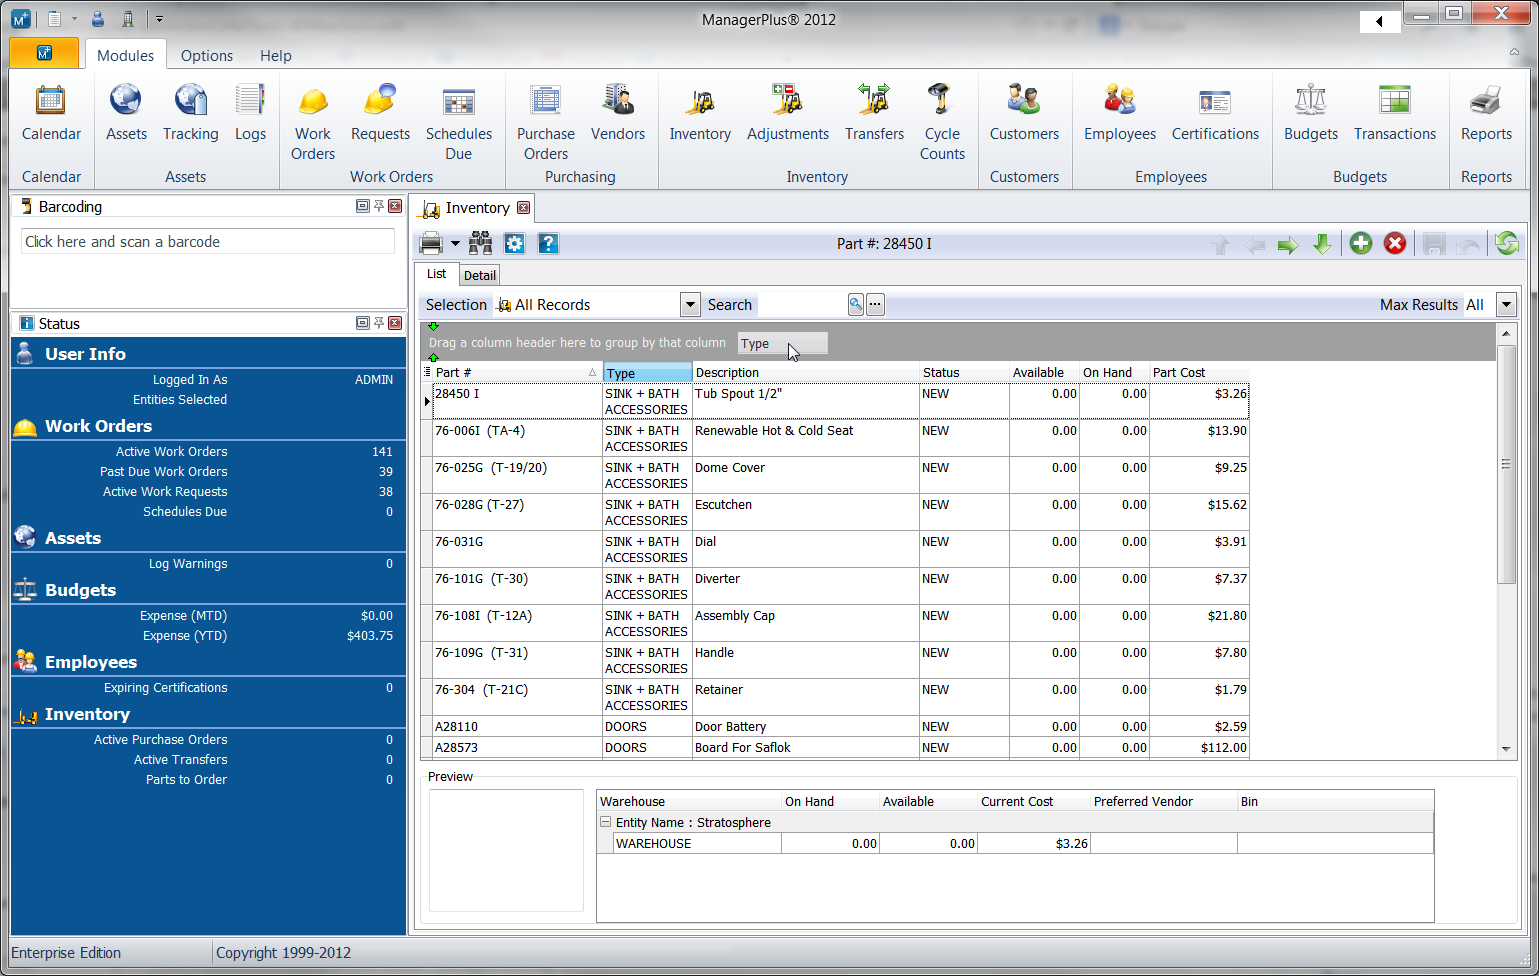
Next, choose which column header you’d like to group your data by, click on it, and drag it into the black bar. In the example below, we have chosen to sort our list by “Type”.
Step 4
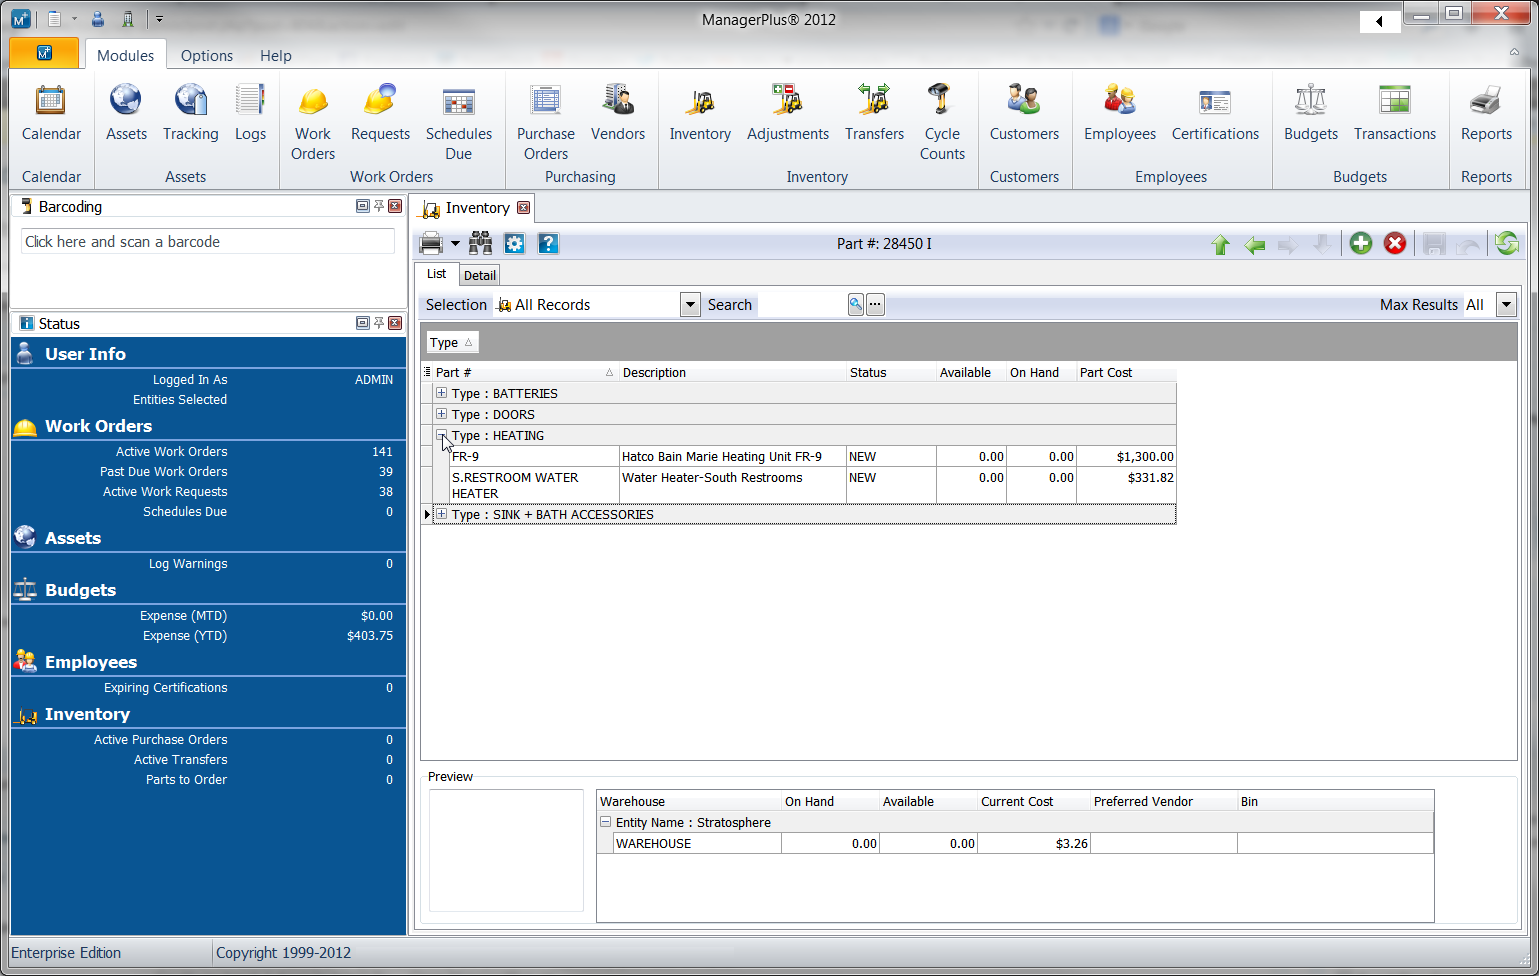
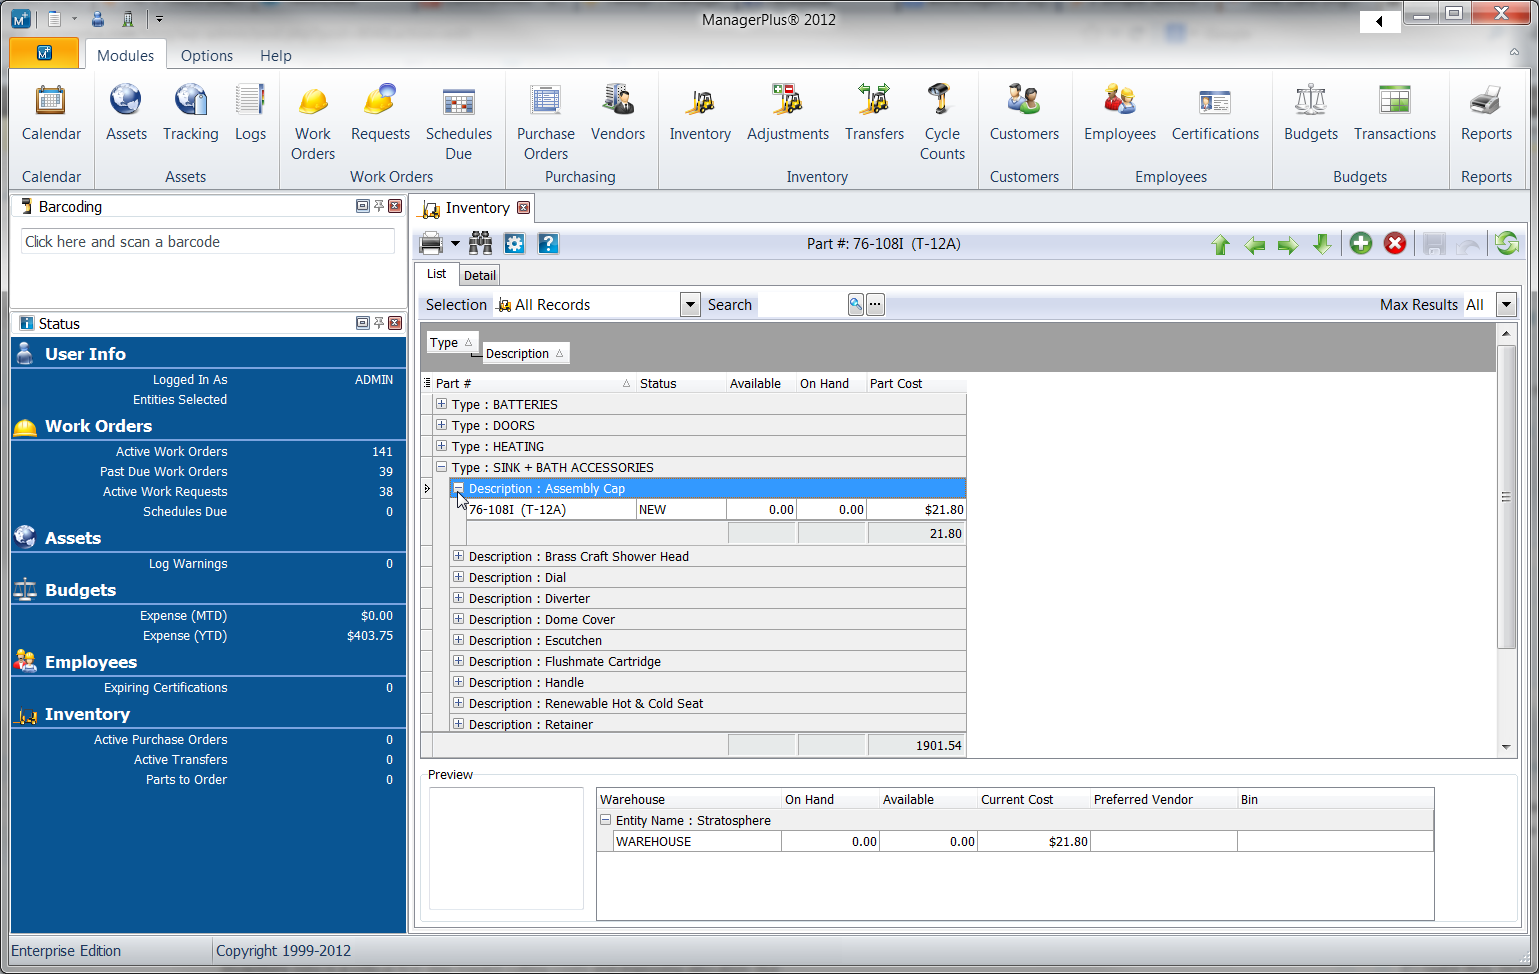
You’ll notice that, rather than displaying all parts, the list now displays only groups of part types. In the example below, there are four groups of part types that inventory is organized into, “BATTERIES,” “DOORS,” “HEATING,” AND “SINK + BATH ACCESSORIES.” By clicking the small plus symbol next to each group, you can expand the list to view all parts contained within that type.
Step 5
Additional column headers can be dragged into the List Grouping bar to create “stacked” or “hierarchical” views. When we drag the column header “Description” into the List Grouping bar, only groups based on part descriptions will appear when the first group (based on Type) is expanded. In the below example, you’ll see groups based on descriptions, such as “Assembly Cap,” “Dial,” “Dome Cover,” etc. Clicking on any of these will reveal all parts contained within that group.
Step 6
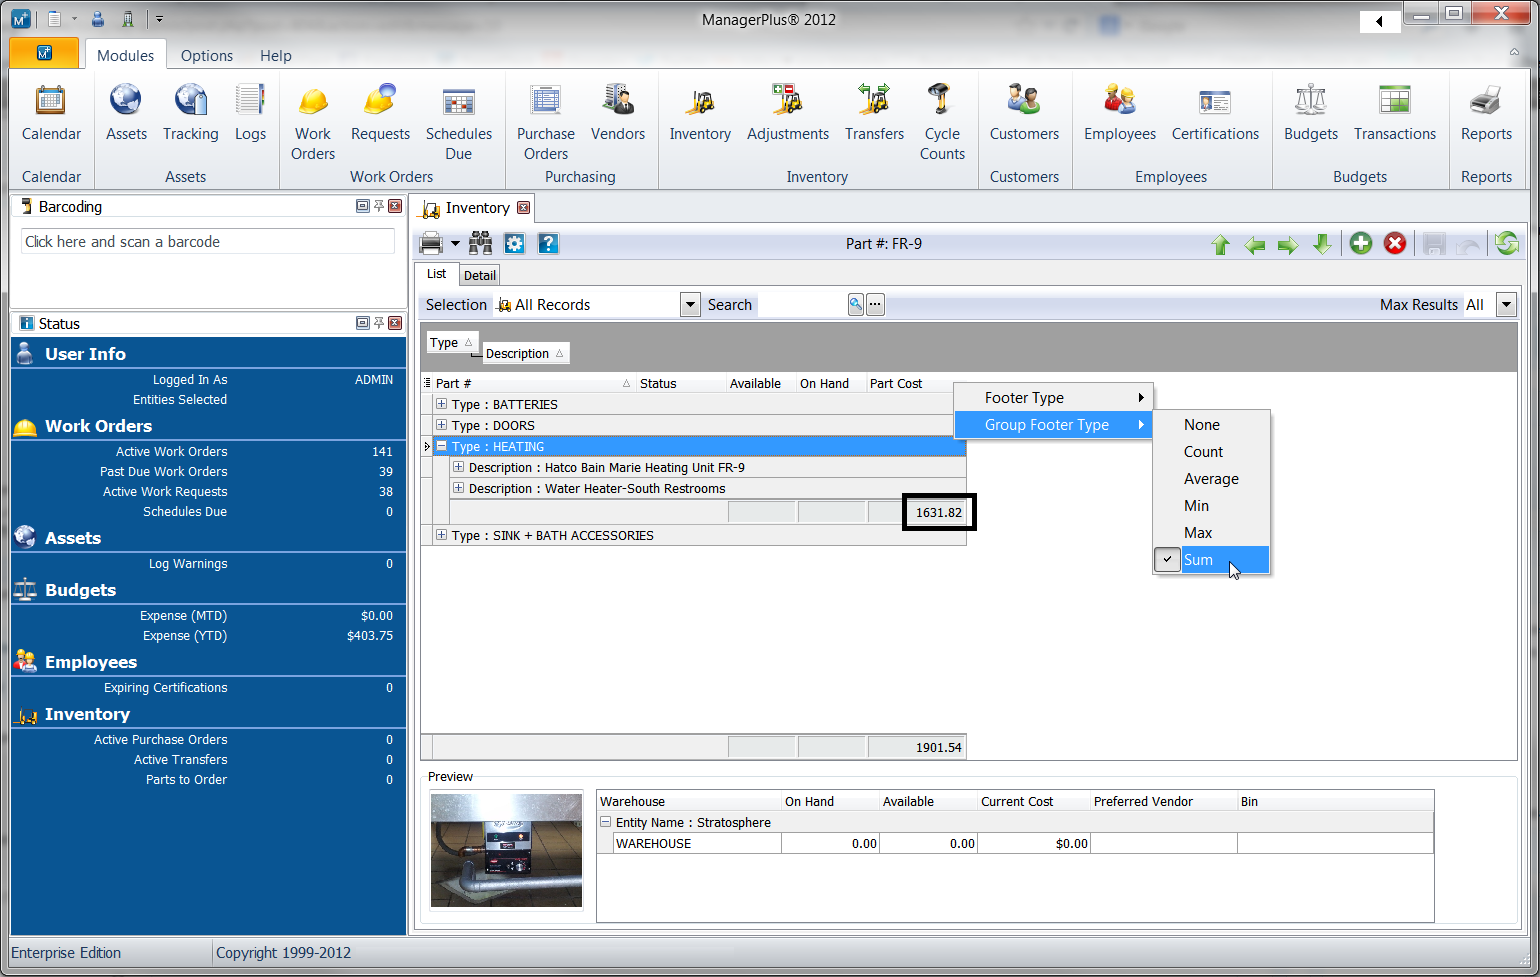
Once you’ve finished grouping and arranging the data, you can use “Group Footer Type” to run basic calculations like average, sum, min, max, etc., for the groups you’ve created. In the below example, our parts inventory has been divided first by “Type,” and then by “Description.” In this example, we want to find the sum of all “HEATING” parts. To get this number, we right click on the column header “Part Cost,” hover the cursor over “Group Footer Type,” and select “Sum.” Now when we expand the data group “Type : HEATING,” we see the total cost of all parts in that group displayed at the bottom of the “Type : HEATING” group. In our example, we find that the sum of all heating parts equals $1,631.82.
Step 7
Note in the above example that we have used “Group Footer Type,” rather than “Footer Type.” This is because we want to see the sum of all parts for the specific group we have created–heating parts in this case. If we want to calculate the sum, average, etc., for all parts inventory, regardless of specific types, descriptions, etc., then we would use “Footer Type.” In the above example, the total cost of all current inventory can be seen toward the bottom of the module–in our example, the total is $1901.54.
Step 8
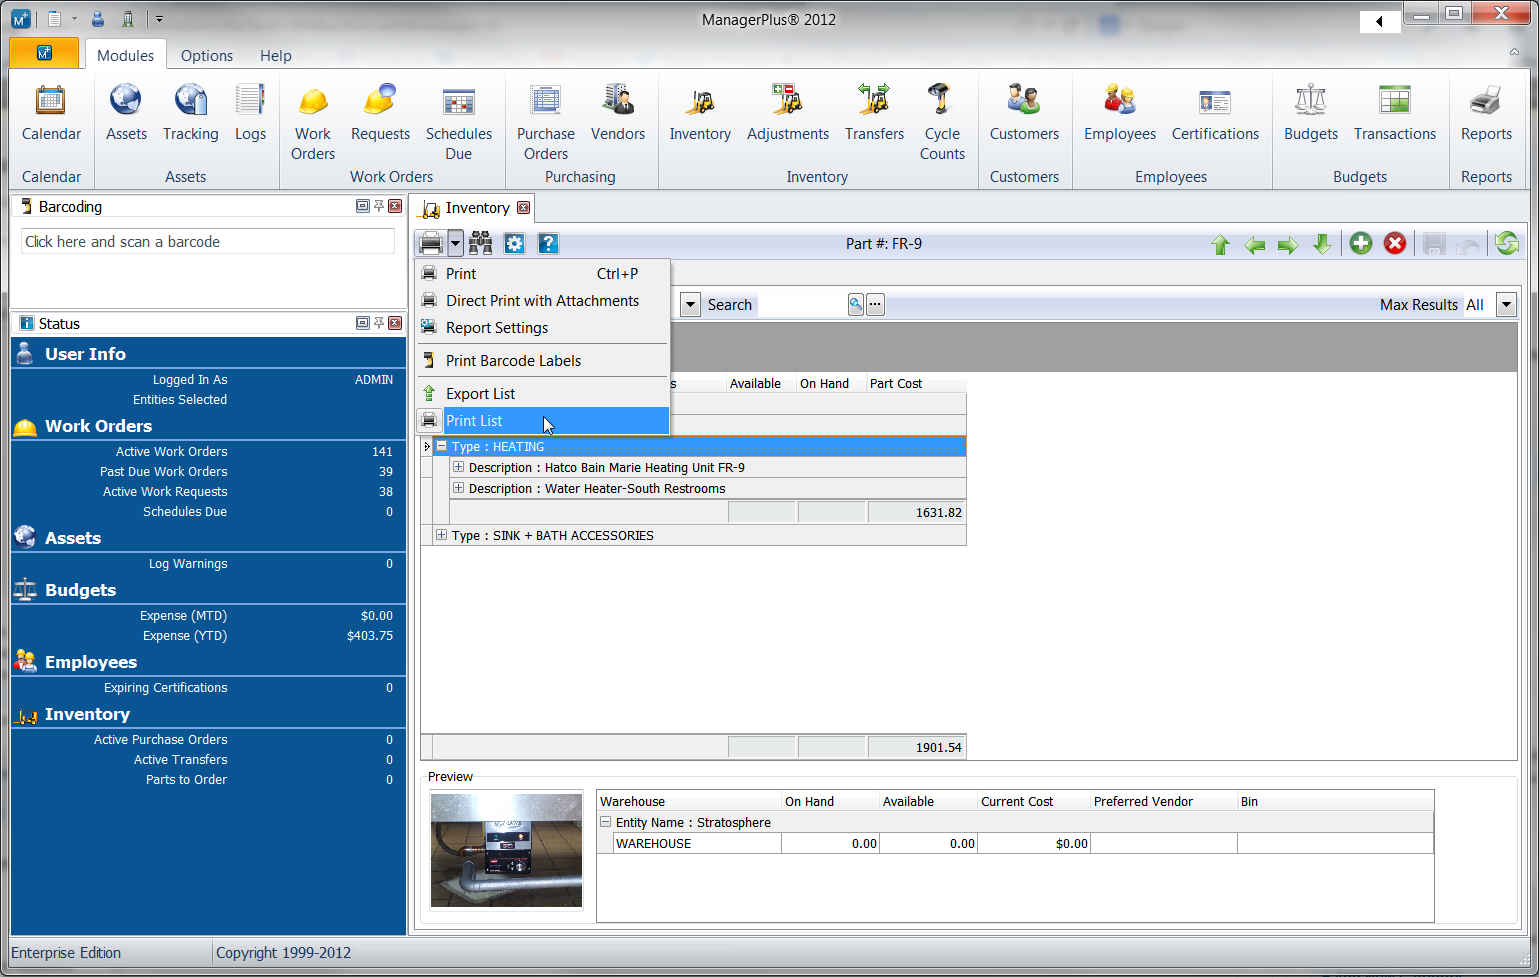
If you want to print any inventory list you’ve created, simply click on the printer icon in the upper left-hand corner of the module and select “Print List.”
Step 9
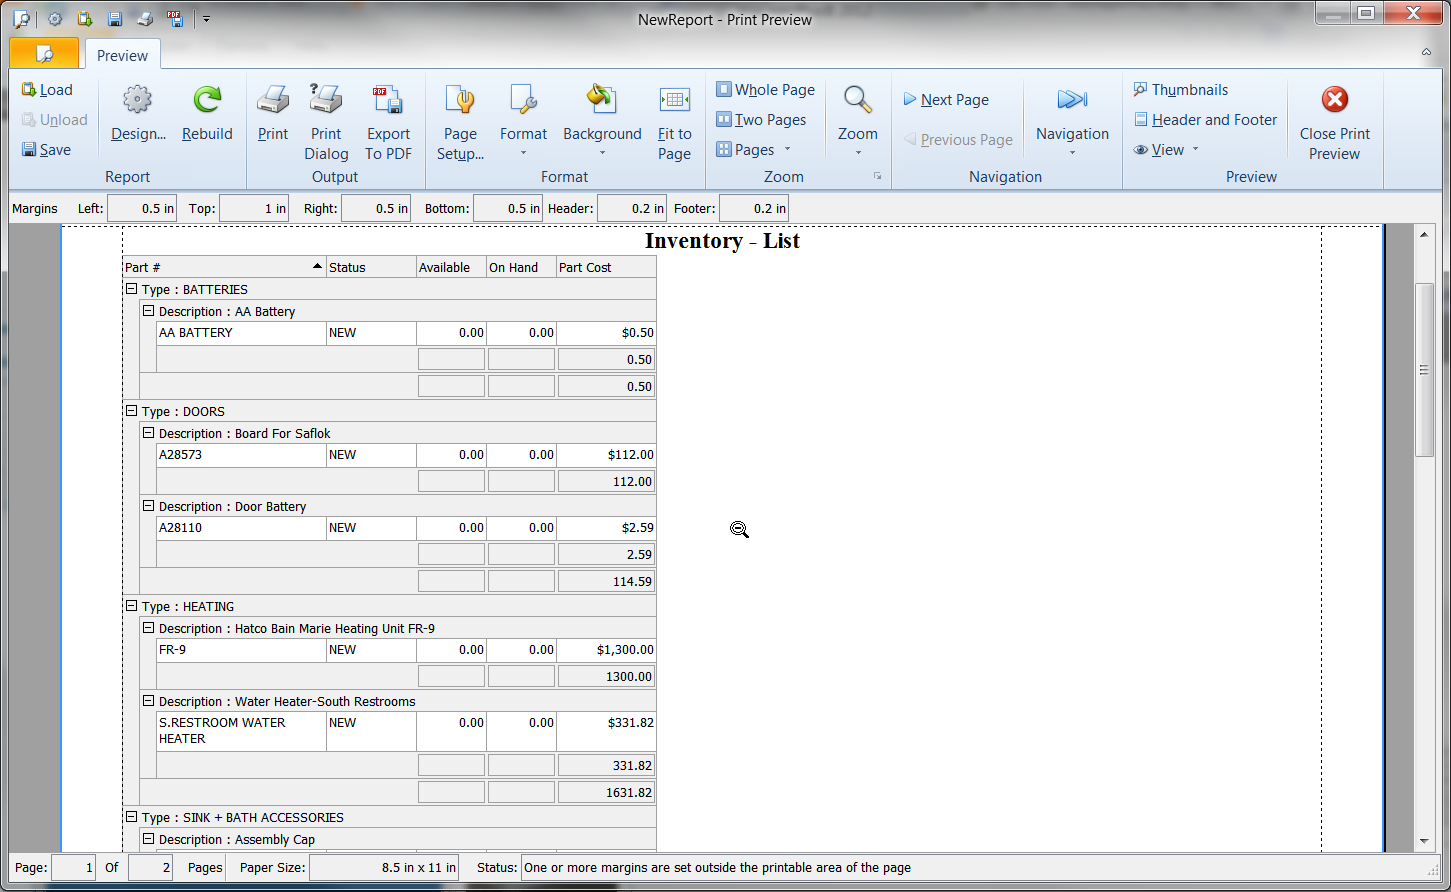
After you click “Print List,” a preview page will appear, enabling you to tweak the formatting before printing.
After just a few minutes experimenting with these tools, you’ll be able to quickly and easily locate critical inventory data, and use it to create basic reports. Be sure to check back here regularly for all the latest news, insights, and tips from ManagerPlus.

